
The Southeast Economy: As Goes the Nation?
“My personal view is that we are sliding into recession” (Martin Feldstein, May 6 2008).1
by David Altig*
Though the world suffers no lack of pundits ruminating on the state of the U.S. economy, Harvard University’s Martin Feldstein is not your run-of-the-mill commentator. In addition to his standing as one of the country’s most respected economists, he is the chairman of the Business Cycle Dating Committee at the National Bureau of Economic Research (NBER), the group that will ultimately decide when a recession starts and when it ends.2 When Professor Feldstein speaks of recession, people listen.
Business cycles are, of course, about economic ups and downs of the fictional average business, average consumer, average employer, and average worker. To borrow a phrase from any number of late-night weight-loss infomercials, individual results may vary.
So what of the Southeast economy? Are we doing better than, the same as, or worse than the U.S. economy as a whole? If I tell you that by “Southeast” I mean the six states represented by the Federal Reserve Bank of Atlanta (or 6th District of the Federal Reserve System) — Alabama, Florida, Georgia, Louisiana, Mississippi, and Tennessee — you might suspect that there is no single answer to that question.3
And you would be right, though in many ways this collection of states is a microcosm of the U.S. economy. At roughly 13 percent of U.S. GDP, their collective gross state product is relatively large. In addition, in terms of business mix the sectoral distribution of production across the Southeast looks a lot like the distribution for the country as a whole. Still, as is true of the entire economy, the pace of economic growth is not nearly uniform throughout the region.
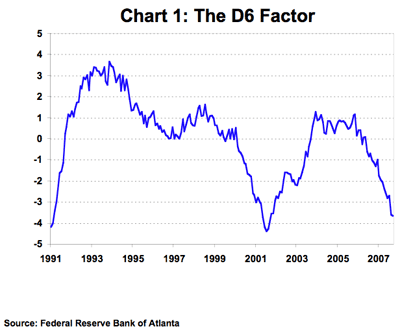
The D6 Factor
Nonetheless, the average performance of the region is a useful starting point. At the Atlanta Fed we have developed a summary statistic for the trajectory of economic activity in the Southeast that we call the “D6 Factor”: an estimate of the trend common in a collection of 25 distinct monthly series of state economic data. It provides a broad measure of the 6th District states’ economic conditions that is timelier and available at a higher frequency than estimates of gross domestic product (GDP) for states made by the U.S. Bureau of Economic Analysis. Moreover, unlike an average of state-level GDPs or other factors, the D6 Factor is able to filter out idiosyncratic shocks that disproportionately affect individual states.4
As can be seen in Chart 1, the news from the D6 Factor is not particularly encouraging. The value of the factor through January was a little more than halfway between its readings at the start of the last recession in March 2001 and the series low at the end of that recession in November 2001. In truth, that may overstate things a bit. Some of the series used in the construction of the D6 Factor are associated with housing, and extraordinarily high Katrina-related readings of Louisiana housing starts and permits in December 2006 made the year-over-year comparisons in December 2007 look exceptionally weak. If Louisiana housing data are removed, the latest reading of the estimated factor is noticeably further from its low. However, with or without that housing data, it is clear that the D6 Factor has fallen sharply since early 2006.
Rather than proceed with a detailed breakdown of each of the series used to construct the D6 factor, I will take a page from the NBER Business Cycle Dating Committee. In assessing the fortunes of the U.S. economy, the Business Cycle Dating Committee tends to focus on a relatively small set of data:
“The committee places particular emphasis on two monthly measures of activity across the entire economy: (1) personal income less transfer payments, in real terms, and (2) employment. In addition, we refer to two indicators with coverage primarily of manufacturing and goods: (3) industrial production and (4) the volume of sales of the manufacturing and wholesale-retail sectors adjusted for price changes”5
We do not have perfect, timely data on each of these series at the state level, though we do have reasonably timely (if noisy) information on employment. Survey-based information gathering provides us some notion of the pace of manufacturing production in the region, and we can get some broad guesses about sales and incomes by looking at state revenue patterns.
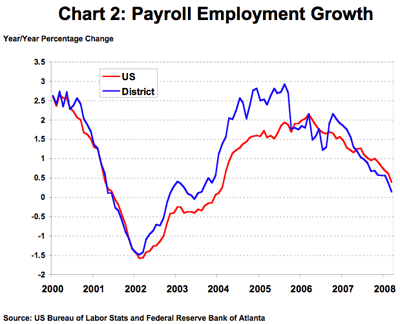
With respect to employment, according to U.S. Bureau of Labor Statistics (BLS) data released on April 18, the states of the Sixth District lost an estimated net 21,800 jobs in March from a month earlier on a seasonally adjusted basis. As Chart 2 illustrates, the decline in regional employment growth is similar to, but somewhat greater than, the national experience.
Even adjusting for size, the contraction in employment growth was certainly not uniform across the Southeast. In fact, not all of the states had employment declines: the preliminary numbers indicate that Mississippi added 2,400 to payrolls in March. The other five states, however, did indeed suffer net job losses: Florida lost 17,400 jobs; Georgia lost 4,700 jobs; and Alabama, Louisiana, and Tennessee lost 300, 200, and 1,600 jobs, respectively.
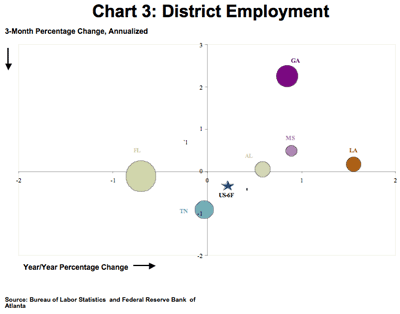
Chart 3 provides a good sense of the disparate employment trends across the Southeast. The horizontal axis measures employment growth in the 12 months from March 2007 to March 2008, and the vertical axis measures employment growth in the first quarter of this year. The size of the bubbles in the chart indicates the relative size of the working labor force in each state. The star represents employment growth in the U.S. outside of the 6th District states. A position to the east in the picture indicates employment growth was positive on a year-over-year basis. A position to the north indicates growth was positive in the first three months of this year.
As the chart makes clear, employment growth has exceeded the non-Southeastern U.S. average in four of the six Southeastern states, the exceptions being Florida and Tennessee. However, in the majority of cases the momentum has been negative, meaning that employment growth over the past three months is slower than for the past 12 months. The exceptions are Georgia and, which is interesting, Florida. In Georgia, the pace of employment growth in the first quarter accelerated sharply from the year-over-year pace. Employment growth in Florida also improved substantially in the first quarter, though that improvement is in the context of being the only state to experience a significant contraction in job growth over the 12-month period through March.
Tennessee looks like the problem case of the group. Not only has the momentum been decidedly negative in the Volunteer state but it is the only state in the 6th District with a significant decline in measured jobs over the January – March period. And, what’s more, the pace of contraction has exceeded the rate of employment decline for the U.S. as a whole.
It is important to bear in mind that monthly employment data at the state level can be a bit dodgy and subject to large revision. The recent (that is, first quarter) data in particular should be viewed with an appropriately skeptical eye. The jump in measured employment growth in Georgia, for example, was driven by an unusually large reported employment gain in January that was not sustained in February and March. Furthermore, the early labor market data from Tennessee seems to be less reliable on average than is the case for the other 6th District states. Still, anecdotal information from around the region is generally consistent with the broad picture suggested by Chart 3: as in the rest of the country, labor markets have weakened substantially over the course of the past year.
If regional labor market data is sometimes shaky in the short run, we have even less concrete data regarding industrial production. However, as part of our monetary policy responsibilities, the Atlanta Fed maintains an active network of business contacts across the Southeast. Most of our industrial contacts reported that production and the volume of shipments were down in March from 2007 levels. About half of the contacts noted that in March their companies had either job cutbacks or fewer hours worked. Firms producing goods for the construction industry continued to report very weak activity. On the bright side, several companies providing specialized products for the auto industry and those that export reported stable or improved conditions in early 2008.
Also weighing on the positive side of the scale is the Econometric Center of Kennesaw State University’s March report on its Southeast Purchasing Managers’ Index (PMI).6 The Southeast PMI for March was 54.3, up significantly from February’s reading of 47.1. A PMI index over 50 indicates that manufacturing is expanding while a reading below 50 means that the industry is contracting, so this jump is qualitatively meaningful.
The Kennesaw State group also currently calculates individual PMIs for Florida, Georgia, and Tennessee. The index values for Florida and Georgia have been rising since the beginning of the year, which appears to be consistent with the state-specific employment data. The index value for Tennessee, on the other hand, declined in three of the past five months.
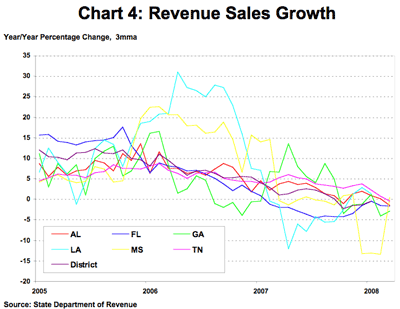
As for sales activity in the region, sales remained weak during March according to an informal survey of district retailers. Most of the Atlanta Fed’s contacts reported that sales continued to decline in March compared with a year earlier. Indeed, tax revenue collections through March suggested that sales and income remained quite weak, as shown in Chart 4.
Is the U.S. in a recession? I’ll leave that one to Professor Feldstein and his Business Cycle Dating Committee. But whether the current period ends up being an official recession or not, it is clear that the economic activity for the nation is quite weak, and that is a description fairly applied to the Southeast as well.
David E. Altig is senior vice president and director of research at the Federal Reserve Bank of Atlanta.
Notes
1. “U.S. Sliding Into Recession: Feldstein,” Greg Robb, MarketWatch, May 6 2008.
2. The committee’s official website.
3. Technically, the 6th District of the Federal Reserve System (Atlanta Fed) includes the states of Alabama, Florida, and Georgia, the southern parts of Louisiana and Mississippi, and the eastern part of Tennessee.
4. For a detailed description of how the D6Factor is constructed, see “When More is Better: Assessing the Southeastern Economy with Lots of Data,” Pedro Silios and Diego Vilan, Economic Review, Vol. 92 No. 3, Third Quarter 2007, Federal Reserve Bank of Atlanta.
5. Statement dated January 7, 2008.
6. Kennesaw State’s PMI is methodologically similar to the Institute of Supply Management’s national PMI, which is a part of the institute’s index on overall manufacturing activity. The index is constructed from survey information on new orders, production, employment, supplier delivery time, and finished inventory.