
Immigrants, Education, and Labor Market: A Perspective from Four States
This study uses a variety of analytical tools to compare and contrast the characteristics of foreign- and native-born population in four states.
by Murat Arik
Immigration has been one of the most debated issues in recent U.S. economic and political discourse. While acknowledging that the scope and nature of immigration has multidimensional public policy implications including concerns about national security, job losses, economic growth effects, health care, and welfare policies, the literature on the impact of immigration on the U.S. economy has generated mixed findings. For example, while Card’s (2001) findings conclude that immigration does not negatively affect the employment and wage levels of native-born workers,1 the finding of Borjas (2003), using similar methodology, suggest just the opposite.2 Taking into account these two contrasting views, Peri (2006) reexamines the wage and employment impact of immigration on native workers using methodology similar to that of the two aforementioned studies.3 His finding suggests that at the national level immigration has a positive effect on the real wages of all but the less-skilled native workers. Peri accounts for the occupational distribution of native and immigrant workers and arrives at a critical conclusion that immigrants at both ends of the educational spectrum are likely to drive productivity, innovation, and competitiveness in the U.S. economy.
From a broader economic perspective, Ford (2007), reprinted in this issue of Tennessee’s Business, highlights the implications of different policies regarding immigration in the U.S. He concludes that immigrants’ contribution to the U.S. economy is sizable and any adverse policies regarding immigration are likely to produce severe macroeconomic repercussions.4 From an international perspective, immigration affects macroeconomic and social dynamics not only in host countries but also in the country of origin through “brain drain” as well as creating shortages in low-skill occupations.5
While these discussions are informative and intellectually stimulating, we nevertheless confine our analysis in this short essay to labor market implications of immigration at the state level from a comparative perspective. Before analyzing characteristics of immigrants, a brief overview of national and global trends regarding economic competitiveness and workforce issues is in order.
Role of Human Capital in Economic Growth
To remain competitive in the knowledge economy, education and innovation should be at the forefront of any development strategy, both at the national and state level. Due to the massive exodus of traditional low-skill manufacturing jobs overseas, there is a pressing need for the existing workforce to reposition itself. According to the recent Global Competitiveness Index of the World Economic Forum, the position of the U.S. in the areas of education and innovation in general and quality of primary education, quality of math and science education, secondary education enrollment, and availability of scientists and engineers in particular is slipping behind more than a dozen countries. In evaluating the impact of immigrants on jobs and wages, this global trend should be kept in mind.
Productivity and Innovation
Productivity and innovation are major sources of economic growth. However, once at the top of the list, the U.S. is losing ground in these areas as many emerging economies are catching up in terms of the number of patents and research and development expenditures. As traditional industries exit the economic landscape, particularly in rural areas, it becomes extremely difficult for small communities to take advantage of technology-driven industries due to the lack of both basic technological infrastructure (i.e., broadband accessibility) and an adequately trained workforce. The promotion of a strong partnership among businesses, workforce, and educational institutions is essential to a knowledgedriven economy.
Aging Workforce
Baby boomers are approaching retirement age. Some small businesses with stable employment are pondering the potential loss of their workforce due to retirement. A critical concern is that it will be difficult to replace retiring skilled employees.
Current Labor Market Shortages
Many local markets have been experiencing labor market shortages, especially in health care. Although many of these jobs are high-paying, there is not enough interest in these occupations to fill the vacant positions. These global and national trends are directly or indirectly linked with the nature and scope of the U.S. immigrant population. Therefore, it is important to keep these issues in mind when discussing the characteristics of immigrants vis-à-vis natives.
Data, Definitions, and Methodology
Data used in this analysis is from American Community Survey 5 percent PUMS (Public Use Microdata Samples) data (www.census.gov). All cross-tabulations are population weighted. The four states somewhat arbitrarily selected for this analysis reflect different geographic, population, and economic structures.
Each state population is divided into two census groups: foreign-born and native. According to the Census Bureau, foreign-born population includes “anyone who is not a U.S. citizen at birth.” This category includes people who are in the U.S. legally and illegally. Native-born population includes “anyone who was a U.S. citizen or a U.S. national at birth.”
This study uses a variety of analytical tools to compare and contrast the characteristics of foreign and native-born population in the four states, addressing the following questions:
- How do the states compare in terms of immigrant population, employers, and labor force participation rate?
- How do immigrants and natives compare by
- age distribution,
- educational attainment,
- distribution across major occupations,
- income distribution, and
- occupational skill level distribution?
Foreign-Born Population
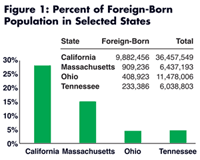
The small fraction of Tennessee’s population that is foreign-born is estimated at 233,386, or 3.86 percent, as of 2006. Corresponding figures are 408,923 (3.56 percent) in Ohio, 909,206 (14.12 percent) in Massachusetts, and 9,882,456 (27.11 percent) in California. Although Tennessee and Massachusetts have comparable populations, Tennessee’s share of foreign-born population is significantly lower. As Figure 1 (.xls tables and figures) shows, the foreign-born population in Tennessee in both absolute and relative terms is nowhere close to the level that California and Massachusetts have been experiencing. Accordingly, public policy challenges that may arise due to certain characteristics of foreignborn population (i.e., legal vs. illegal, skilled vs. unskilled, etc.) are likely to be more manageable in Tennessee than in California and Massachusetts. The significant variation in the share of foreign- born population across states implies that immigrants’ role6 in the U.S. economy should be analyzed within the context of workforce supply and demand at the state level.
Decade of Entry
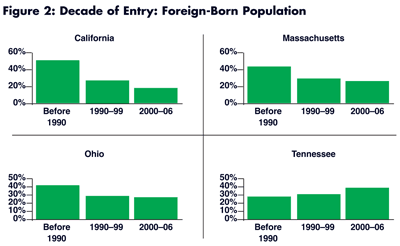
As Figure 2 illustrates, the influx of foreign-born population is relatively recent in Tennessee compared to California, Massachusetts, and Ohio, where more than two-fifths of foreign-born population entered the country before 1990. According to the American Community Survey (2006), nearly two-fifths (93,000) of Tennessee’s foreign-born population entered the U.S. between 2000 and 2006. However, although the proportions are smaller, Massachusetts attracted more than 180,000, Californian nearly 2,000,000, and Ohio about 120,000 in foreign- born population in the same period.
Age Cohort
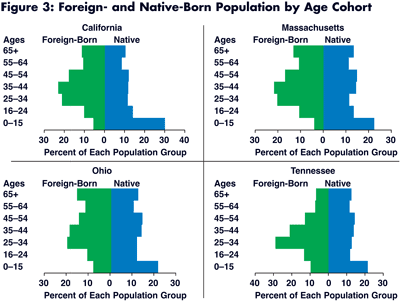
Foreign-born population is more normally distributed than native-born population across the states by age cohort. Immigrants migrating to Tennessee tend to be younger than those immigrants migrating to the other three states (Figure 3). The Tennessee population pyramid indicates fewer immigrants in the old age cohort—not the case for the other three states, where old-age dependency (on younger workers) among immigrants is relatively higher.
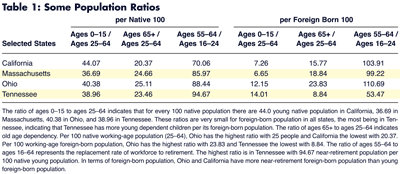
Figure 3 and Table 1 present workforce implications for the aging native-born U.S. population. As the baby boomers approach retirement, businesses expect to see increasing shortages across occupations. In Tennessee, the ratio of ages 55–64 to 16–24 among the nativeborn population is merely at replacement level. This ratio is relatively better for California, Massachusetts, and Ohio. However, the foreign- born population story is different: while California and Ohio have a higher near-retirement than young foreign-born population, Tennessee’s trend is completely opposite with a nearly 50-percent higher young than near-retirement foreign-born population.
Skill Composition
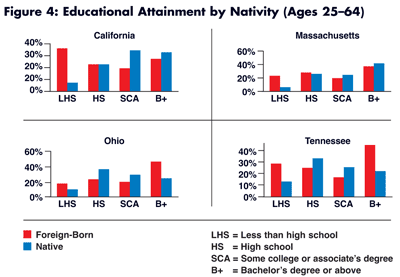
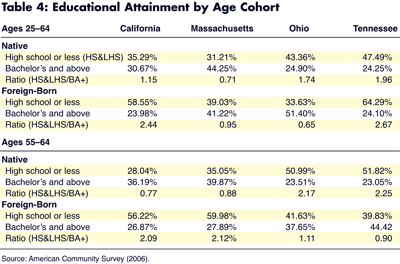
Is the skill level of immigrants complementary to the skill level of natives? National studies suggest so, indicating that distribution of the educational attainment of immigrants is U-shaped compared to an inverse- U shape for natives. Figure 4 illustrates significant variations across states in this area. In California and Tennessee, distribution of immigrants by educational attainment confirms this pattern. However, in both Ohio and Massachusetts, distribution is skewed toward a higher immigrant educational attainment level. In terms of the inverse-U distribution of nativeborn population by educational attainment, Ohio and Tennessee exhibit certain similarities. Overall, educational attainment by nativity in Tennessee confirms U-shaped immigrant and inverse-U native-born educational attainment.
In Tennessee, 14 percent of the native-born and 29 percent of the foreign-born population have less than a high school education. However, at the other end of the spectrum, 31 percent of the native-born and 45 percent of the foreign-born population have at least a bachelor’s degree.
Occupational Distribution
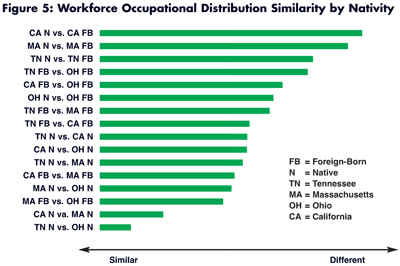
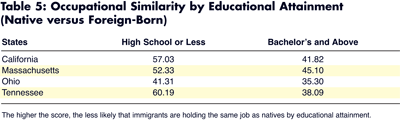
Do the immigrant and native workforce (ages 25–64) differ by occupational distribution? Figure 5 shows considerable differences between them even at the aggregate level.7 One caveat is in order: for practical purposes, this study looks only at 26 aggregate-level occupational categories. Using more detailed categories would likely increase the occupational similarity index score. The larger the index score, the more dissimilar two occupational distributions are.
Within-state occupational distributions of workforce by nativity indicate variations across states, reflecting their economic structure and immigrant workforce characteristics. One clear conclusion is that the immigrant and native workforces in the four states are not holding exactly the same jobs. Of the four, California has the highest occupational dissimilarity index between its native and foreign-born workforce.
Although native workforce occupational distribution in Ohio and Tennessee shows close similarity, the same is not true for the foreignborn workforce. These dissimilarities suggest that immigrants’ contribution to the states’ economies is considerable and the immigrant and native workforces are complementary.
Labor Force
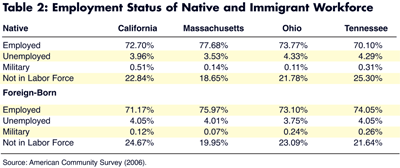
Labor force participation rates of natives and immigrants are comparable across the states, although immigrants’ participation rate is higher than that of natives in Tennessee. Table 2 presents the employment status of native and immigrant population ages 25–64. Unemployment is lower among immigrant than native working-age population in Tennessee and Ohio, whereas the reverse is true in California and Massachusetts.
Class of Worker
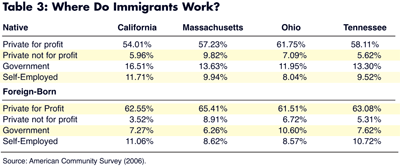
There are relatively as many immigrant as native entrepreneurs across the states. Tennessee has slightly more selfemployed immigrants than natives. Table 3 shows that immigrants are overwhelmingly working in the private for-profit sector and playing an important role in entrepreneurial activities that drive many of the states’ economies. Only in Ohio is the percent of immigrants versus natives working for government comparable.
Education and Age Cohort
Table 4 reveals significantly better-educated near-retirement age than young immigrants in Tennessee, perhaps due to the large influx from war-torn regions between 2000 and 2006. Massachusetts and Ohio are attracting more highly educated than less-educated young immigrants. Conversely, California is attracting 24 and Tennessee 27 less-educated immigrants for every 10 highly educated ones.
An analysis of the characteristics of nearretirement age (55–64) immigrants, however, shows a completely different picture for Tennessee, Massachusetts, and Ohio. For example, in Tennessee, in the 55–64 age category, there are nine less-educated immigrants for every 10 highly educated immigrants. For the 25–34 age category, the trend is almost reversed in these three states, whereas California shows a somewhat stable trend across age cohorts. These discrepancies may be attributable to workforce supply and demand resulting from the states’ changing economic structure and growth trends.
Education and Occupation
Those immigrants with a high school education or less are holding jobs not in high demand by similarly educated natives in Tennessee. Table 5 indicates the significant differences in occupational similarities of natives and immigrants across and within the states by educational attainment, even at a higher educational level. This result may suggest an existing or emerging division of labor between immigrants and natives by educational attainment levels.
Wage and Salary Earnings
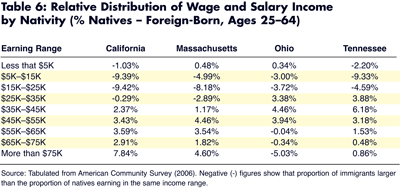
Distribution of wage and salary earnings of immigrants is disproportionally concentrated in low-income brackets in California and Massachusetts (under $35,000). Although Ohio and Tennessee exhibit a similar pattern in low-income brackets (under $25,000), they differ from California and Massachusetts in two respects: in Ohio, immigrants are disproportionally concentrated in highincome brackets, while in Tennessee the concentration of immigrants and natives in high-income brackets is relatively even ($65,000 and over). Table 6 highlights the variations of earning distributions of immigrants compared to natives across the states. This distribution in turn may be related to structural differences in the states’ economies and characteristics of immigrants choosing these states as their homes.
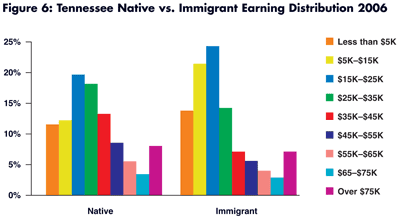
Wage and Salary Earnings in Tennessee
In Tennessee, nearly 74 percent of immigrants are earning less than $35,000 compared to 62 percent of natives. These numbers are 65 and 45 percent in California, 58 and 43 percent in Massachusetts, and 59 and 56 percent in Ohio. Figure 6 presents the earning distribution of immigrants and natives in Tennessee.
Conclusion
This study highlights the characteristics of immigrant versus native populations in the four selected states. The findings suggest that the size and scope of immigrants’ involvement in these states’ economies vary considerably. This has a lot to do with the historical presence of large immigrant communities in certain states (i.e., California). However, the structural differences in these economies and ensuing demand for a certain type of immigrant workforce (i.e., skilled, unskilled) are also an important factor in across-state variations.
Tennessee has a relatively small immigrant population, two-fifths of whom entered the U.S. in the past five years. The sudden burst of relatively young, low-wage earning immigrants may pose a challenge. However, booming activity in commercial and residential construction as well as the retail sector in the past five years has increased the demand for workforce considerably, attracting many immigrants to the area.
Murat Arik is the associate director of MTSU’s Business and Economic Research Center.
Notes
1. David Card, 2001, “Immigrant Inflows, Native Outflows, and the Local Market Impacts of Higher Immigration,” Journal of Labor Economics 19.
2. George J. Borjas, 2003, “The Labor Demand Curve Is Downward Sloping: Reexamining the Impact of Immigration on the Labor Market,” Quarterly Journal of Economics 118.
3. Giovanni Peri, 2006, “Immigrants, Skills, and Wages: Measuring the Economic Gains from Immigration,” Immigration Policy in Focus 5.
4. William F. Ford, 2007, “Immigrationomics: A Discussion of Some Key Issues,” Economic Education Bulletin v. 47.
5. For a comprehensive review of the implications of immigration from an international perspective, see World Economic and Social Survey 2004, Part II: International Migration (Department of Economic and Social Affairs [United Nations], New York, 2004), available at www.un.org/esa/policy/wess/.
6. “Foreign-born population” and “immigrants” are used interchangeably throughout this analysis.
7. Index used to calculate the similarities of occupational distribution of workforce by nativity is Si = Ĺú | xni –yfbi | where Si is similarity index, xni is the percent of native workforce holding occupation i, and yfbi is percent of foreignborn workforce holding occupation i. This formulation allows us to make workforce occupational similarity comparisons within a state and between states by nativity.
screen pdf version | print pdf version | .xls tables and figures | Tennessee’s Business | BERC