Tracking Recovery continued
print pdf | 1 | 2 | 3 | 4 | 5 | 6 | 7 | 8 |
County DataThe Tracking Tennessee's Economic Recovery site provides this labor and employment data for each Tennessee county. Figure 2 below is a graph of the labor force in Anderson County for the period starting in October 2008. In addition to the graph, it is possible to download from the site the actual data from January 2006 to the latest available.
|
|
|||||||||||||||||||||||||||||||||||||||||||||||||||||||||||||||||||||||||||||||||||||||||||||||||||||||||||||
Fig. 2. Anderson County Labor Force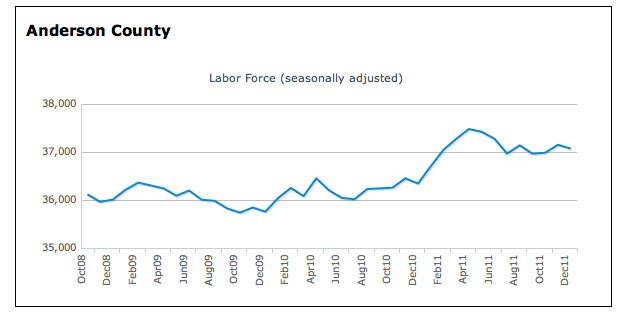
|
||||||||||||||||||||||||||||||||||||||||||||||||||||||||||||||||||||||||||||||||||||||||||||||||||||||||||||||
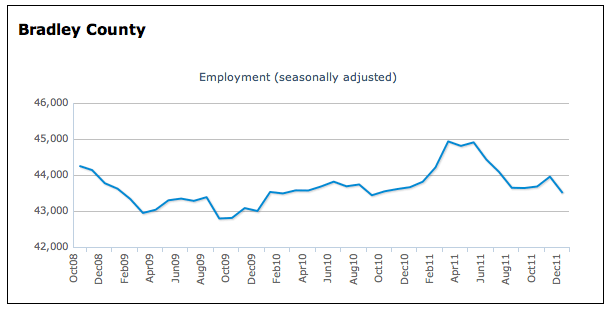
Employment data are available as well. For example, Figure 3 below shows total non-farm employment for Bradley County monthly from October 2008 to December 2011. These data are seasonally adjusted, which means that the regular seasonal patterns that appear annually have been accounted for. An example would be employment that typically peaks annually just before the holiday period in November and December but declines in the early months of the year and then increases as spring arrives. Statistical programs are used to make these adjustments in much reported economic data. Unadjusted data are usually available as well from most sources.
|
Since the total number employed bottomed out in late 2009, employment growth has been irregular and modest at best. |
|||||||||||||||||||||||||||||||||||||||||||||||||||||||||||||||||||||||||||||||||||||||||||||||||||||||||||||
Fig. 3. Bradley County Employment |
||||||||||||||||||||||||||||||||||||||||||||||||||||||||||||||||||||||||||||||||||||||||||||||||||||||||||||||
The site also provides employment data by industry for the state and for the 10 metropolitan statistical areas (MSAs). Detailed data are available at the county level only on an annual basis and thus not reported on this site. Table 1 below gives detailed state-level data for each December in the years 2007 through 2011. The numbers show the business cycle peak in December 2007, a decline in total nonfarm employment through December 2009, and then a painfully slow increase through November 2011. It is also evident that the cycle did not follow exactly the same pattern in every sector of the state's economy.
|
The numbers show the business cycle peak in Dec. 2007, decline through Dec. 2009, and slowly increase through Nov. 2011. |
|||||||||||||||||||||||||||||||||||||||||||||||||||||||||||||||||||||||||||||||||||||||||||||||||||||||||||||
Table 1. Tennessee Employment by Industry Sector
Source: TN Dept. of Labor & Workforce Dev. Research & Statistics, BERC |
||||||||||||||||||||||||||||||||||||||||||||||||||||||||||||||||||||||||||||||||||||||||||||||||||||||||||||||
|
|
||||||||||||||||||||||||||||||||||||||||||||||||||||||||||||||||||||||||||||||||||||||||||||||||||||||||||||||