Tennessee 2010 Census Report


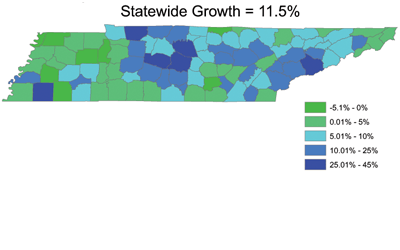
100 Years of Population Growth
Tennessee's 10-year growth of 11.5% is on par with the long-term growth of 11.7% .... read more
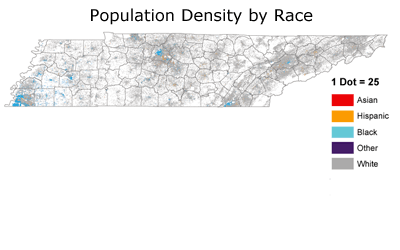
Population Density by Race
Of the 656,822 more Tennesseans in 2010 than in 2000, 25% are of Hispanic origin .... read more
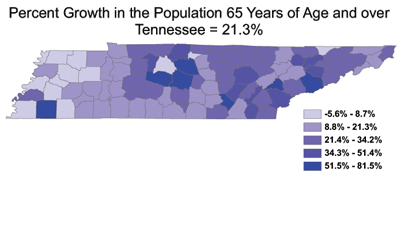
Age Groups: Under 18 & Over 65
By far, the segment with the highest growth rate is 65 and over. 38 counties showed a net loss of children since 2000 .... read more
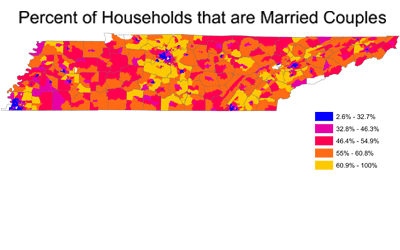
Households: Married or Single
48.7% of Tennessee households are a husband-wife family. Single-person households are found more in urban areas .... read more