
Time to Gird for Rough Times: Forecast Commentary (part 2)
Homeowner Bailout Is Not Far Behind
The only major players willing to buy mortgage loans are the government-sponsored entities, or GSEs: Fannie Mae and Freddie Mac. But they are only allowed to buy conventional loans or mortgages under $417,000. Hence, the latest stimulus package signed on February 13 allows the ceiling for conventional loans or below jumbo loans to be temporarily raised in high-cost areas and only in the case of new loans. (Just to brag, this proposal was one I suggested on page 6 of my August 2007 forecast report when the credit crunch first surfaced.) That apparently has led to another problem that was solved recently: inadequate capital to buy those loans. GSEs are the only liquid player in the securitized markets (81% of the market recently!) and will quickly approach the limit on how much they can hold on their balance sheet. Hence, the capital requirements were dropped for the GSEs in early May by the Office of Federal Housing Enterprise Oversight — the same agency that put the muzzle on Fannie Mae for its accounting irregularities only a few years ago.
Dropping the capital limits from 20% to 15% provides a fresh shot of liquidity into the mortgage market, especially combined with higher jumbo loan limits. And just to purchase insurance, Fannie Mae recently raised $6 billion in new capital. Why is this small amount so significant? Because the GSE can leverage it more than 30 times to transact $200 billion worth of securitization, enough to keep the mortgage market going for this year.
Now here is something you will love. Bear Stearns was leveraged around the same ratio when it had a bank run because its creditors (other banks and counter parties in complex derivative trades) became worried about its ability to repay its debt. As it was financing itself on very short-term credit, Bear Stearns was in all totality a hedge fund by the end. And not just Bear Stearns but every major Wall Street bank does this kind of leverage-stoked trade. So now you can understand why opening the Fed discount window to these banks was a much-needed, bold move by the central bank.
However, GSEs can borrow in the credit market for much longer maturity, which also comes with the implicit guarantee of government-backed debt obligations. Thus, the ball is now rolling in the direction of a government-sponsored bailout of homeowners, one way or another. Martin Feldstein of NBER has a proposal where the government may issue 2-year bonds to finance 20% of a consumer’s mortgage balance. This debt is cheaper than the mortgage rate but also is bankruptcy proof, i.e. you can’t renege on this debt under any condition. This way, a homeowner gets a cost break while the bank can reduce its exposure and also become more liquid in the process. Sounds good to me, but again, who will pay off the interest cost and losses on that debt? The answer is we the taxpayers, especially those who have been paying their bills and refraining from taking foolish loans to live large. And who says the bond option will be limited to only 20% of the loan balance? For example, in places like California and Florida, prices are already down 30% to 40%, and people are just walking away from their obligations. Maybe the government will become responsible for assuming 30% or even up to 50% of the debt. There is no end to this scheme. Therefore, I prefer Chairman Bernanke’s proposal: banks should forgive part of the loan in these extreme cases. Congress is trying to take this proposal further by letting borrowers refinance the leftover amount through the FHA. But again the moral hazard remains: get a big loan and then land at the bank’s door asking for forgiveness. The bank then turns around and dumps the problem in the government’s lap. Who pays? Tomorrow’s taxpayers.
The 21st-Century Recession
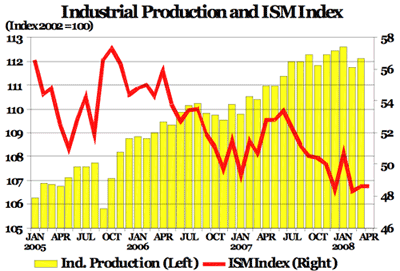
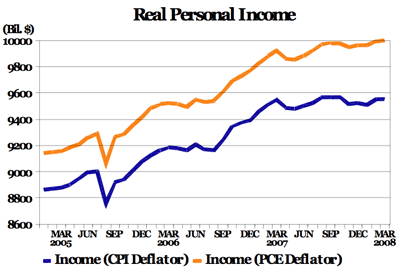
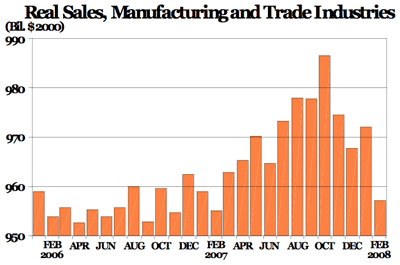
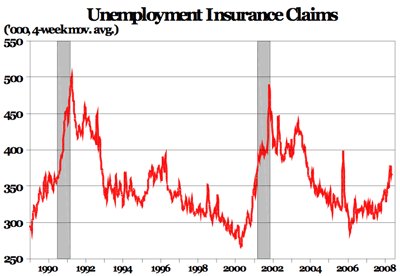
Is the economy currently in a recession? The answer is a complicated yes. The NBER does not define a recession in terms of two consecutive quarters of decline in real GDP. Rather, a recession is a significant decline in economic activity spread across the economy, lasting more than a few months, normally visible in real GDP, real income, employment, industrial production, and wholesale/retail sales.
Real GDP growth in the past two quarters was abysmal but still positive. The latest quarter was positive, thanks to robust export growth and a better-than-expected growth in national defense spending. However, nondurable consumption growth was almost zero on a year-over-year basis. The
The
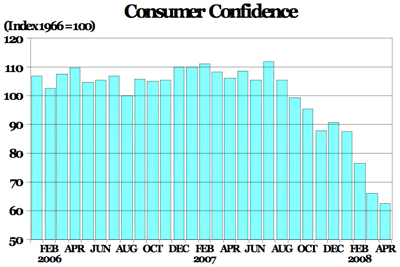
Net-net, it is hard to say that a “significant” decline in economic activity by monthly indicators has happened in the past six months. However, if we look at the consumer confidence level in the
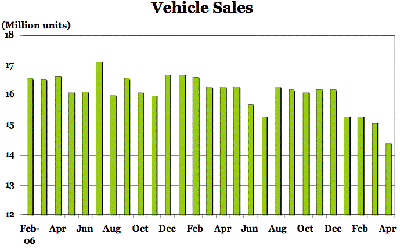
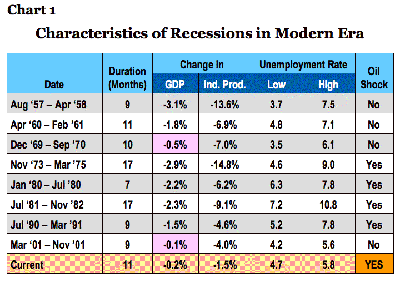
So, when did the recession start? This question is tricky. Some indicators point to last fall and some to December. If I combine the two hardest metrics — private employment and vehicle sales — then the peak of the last expansion was reached in December of last year. Chart 1 summarizes the traditional characteristics of recessions for the past 50 years: duration, change, or cumulative drop in GDP and industrial production; unemployment lows and highs; and whether an oil price shock preceded the recession. The current episode is expected to last until early winter and will be very mild by historical standards. It will be slightly worse than the last recession but nowhere near the 1973 – 1975 recession, when oil prices were at record levels.
Although that recession was preceded by an oil shock, it was quite different in many respects from what is happening in the economy today. One, the price in the 1970s had quadrupled in response to an OPEC embargo, which was a major shock to the system that intensified when misguided price controls were used to combat it. That event led to a severe loss of productivity at the national level, which is not the case now. Also, the fuel bill back then shot up dramatically in a span of months, whereas this time the rise is “orderly” but painful. People have had a chance to adjust their behavior to combat this oil rise rather than having a knee-jerk adjustment as in the 1970s. But again, looking at the employment data, it wasn’t until mid-1974 that any significant job losses materialized, almost a year after the recession had officially started. In that sense, one might get complacent looking at job loss numbers from the past few months, but recessions have a tendency to surprise.
Fed, Fear of Inflation, and Recovery
Mercifully, after the last cut on April 30, the Fed clearly signaled it was done with rate cutting for the time being. The Fed indicated that it had bought enough of an insurance policy to protect against a slowdown or recession based on economic fundamentals. The credit market squeeze will take its time to unwind and will require behind-the-scene maneuvers instead of overt actions such as rate cuts, which play well in the media for both the layperson and the politicos on Capitol Hill. Now, the issue is when the Fed will start raising rates. The situation is complicated because it depends not only on when the economy recovers but also on how the high oil and food grain prices, already extremely elevated, are going to behave in the coming months.
Let’s examine the food price increase first. What’s the reason behind the dramatic rise in grain prices? One reason postulated is the quest for energy independence by the United States. As the argument goes, production of ethanol from corn (as a substitute for oil) is a factor in rising corn prices during the past few years. While I sympathize with this argument, I have trouble understanding why rice and wheat prices have tripled in the past nine months. Rice and wheat are not ingredients for ethanol production. As consumers, we haven’t given up on the Atkins diet to become pasta eaters overnight! What I am saying is that our eating habits haven’t changed or cannot change in the short run. Something else is going on.
Another explanation frequently given is that developing countries, such India and China, tend to adopt a Western diet as their GDP rises. If the populace is eating more meat, mirroring a Western diet, then this argument also is problematic as a direct correlation for rising grain prices. However, because grain is used as feed for livestock, it can indirectly influence a rise in grain prices. On the other hand, a more reasonable argument is that as more consumers in developing countries rise out of poverty, they are eating bigger portions and becoming prone to the same obesity that is rampant in the United States. What Baskins-Robbins did for our waistlines here will happen there, too. However, this process is a slow one of incremental changes in demand that cannot account for rising prices over the past six months.
Supply-side reasoning suggests that although the stock of grain production in world is huge, the flow or the quantity traded on the world market is very small. Thus, any small change in supply because of crop failure or drought can result in a supersized effect on grain prices. For example, the ongoing drought in Australia has impacted wheat supply in the world. Also, when corn prices rose, many people switched to other grains for the food source, and that substitution in turn will have a ripple effect across all grains.
Additionally, grain prices are governed by the whims and fancies of countries that are major producers. In the case of rice, for example, at times rice exporters have imposed constraints on trade by shutting off exports in response to high international prices. This action is carried out to keep domestic prices low so as to subsidize their own populace’s consumption of grain. However, some countries also subsidize imports of food grains. They are the ones now having the biggest trouble in dealing with the rising cost of government subsidies. They can’t reduce their imports because the price signal for their population is distorted, marking one of the biggest problems in the grain market right now.
In summary, world reserves of grains are very low due to drought and an increase in demand, but the rising prices are getting a steroid boost from the market-clearing hurdles that major producers are putting in place to protect their populace. At this juncture, the U.S. desire to produce ethanol from grain is like adding gasoline to the fire. However, this analysis has implications for a future rise in grain prices, too. Because grain prices are not driven by inflation expectations, harvests will return to normalcy (all droughts end sooner or later, even the 10-year cycles of the arid West), and prices will moderate. Because the rise in food prices is unsustainable, the Fed doesn’t have much to fear. More important, it is unable to do much to affect the fundamentals of food supply. The global slowdown will take care of the demand-side issue. Meanwhile, this issue will hog the headlines, and all of us well-fed people will opine about how bad prices are, with an international food protest or two making the nightly news broadcast.
The basic question, however, remains unsolved. What caused the price of oil to go sky high despite the slowdown in the world economy? Every forecast cycle I write about moderation in oil prices, and every period they creep higher. This repetition has made me think about the oil market in a different way. Yes, hedge fund managers who have lost money in the credit crunch’s aftermath are doubling up to recoup their losses, and one avenue they have is speculation in commodities. The Fed’s easy money policy helps by lowering the cost of borrowing. However, pure speculation can’t be driving rising prices because future contracts require two willing parties: one to bet that prices will rise and the other to bet that they will fall. If everyone is betting that they will rise, then there is no one to take the bet! In economics, we call this the impossibility theorem.
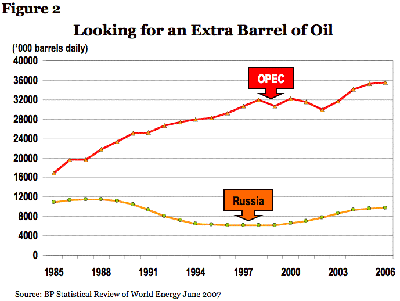
Speculation is unable to cause a sustained rise unless market impediments exist. Consequently, a resolution of this issue has implications for when the Fed will raise the benchmark rate. If we have purely a supply-side problem, then the Fed will be patient in taking back its easing. In other words, this rise in cost-push inflation will only be a jump in the price level rather than a sustained rise. A jump in the price level then only requires a tough skin to ride out the storm by focusing solely on the output side. Therefore, let’s examine the case from the supply side, considering the behavior of major producers, namely Russia and OPEC, which together constitute about two-thirds of the world oil supply.
Figure 2 shows the production of oil by OPEC and Russia since 1985. OPEC has more than doubled its production in the past 20 years, whereas Russia’s production is pretty much the same. Therefore, a dominant producer from the ’80s and ’90s now is dragging its feet. The relationship of the West, notably that with the United States, is less warm in the Putin-led Russia than it was in the Yelstin era in the 1990s, when Russia acted as an ideal counter to OPEC’s power. Today, Russia just has to sit back and enjoy the spoils. Furthermore, this situation is not reversing anytime in the near future.
Net-net, the high price of oil is a permanent feature of this decade. If we adjust the oil price for the drop in the value of the dollar against the euro, we get about $80 as the floor for the price of oil. This level is where it will be one year from now. In between, consumers should be prepared to pay more than $100 per barrel until late fall when the global slowdown finally begins to makes a dent in the price. The people with power to manipulate markets are not immune to the laws of demand and supply. Meanwhile, calls to stop adding to the Strategic Petroleum Reserve are just another form of political pandering, making it look as if our elected leaders are doing something. The only solution is conservation on a permanent basis. (back to Part 1)
Rajeev Dhawan is the director of the Economic Forecasting Center at J. Mack Robinson College of Business at Georgia State University.
print version | Tables (.xls) | Indicators | Highlights | Tennessee’s Business | BERC