Forecast Highlights
by Rajeev Dhawan*
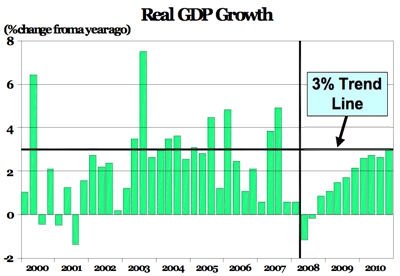
Real GDP (graph)
The economy will enter into the recessionary zone in the coming quarters — with a 1.2% drop in the second quarter, followed by a 0.2% drop in the third. In the last quarter of 2008, the economy will grow by only 0.8%. The major drag on the economy in the coming quarters will be a slowdown in business investment growth and a sharp deceleration in consumer spending. The GDP growth fails to cross the 2.0% mark until late-2009. Overall, real GDP growth for 2008 will be 0.9%, rising slightly to a 1.0% rate in 2009. In 2010, real GDP will grow by 2.5%, still below the trend rate of 3.0%.
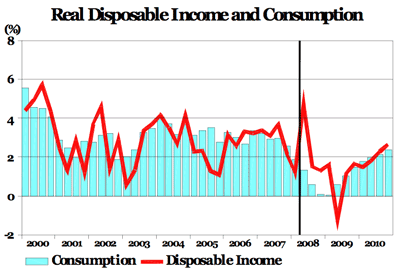
Personal Consumption Expenditures (graph)
Consumption growth is expected to be negative in the next two quarters before it improves to a barely positive 0.2% growth rate in the last quarter. For 2008, consumption growth will be 0.9%, before moderating to 0.8% in 2009. It will rise by 2.1% in 2010. Durable goods consumption will decline by 3.9% in 2008 and 1.8% in 2009, before experiencing a sharp 2.6% rise in 2010. Nondurable goods consumption will remain flat in 2008, increase mildly by 0.8% in 2009, and rise 2.0% in 2010. Consumption of services is expected to grow by 2.3% in 2008, 1.2% in 2009, and 2.1% in 2010.
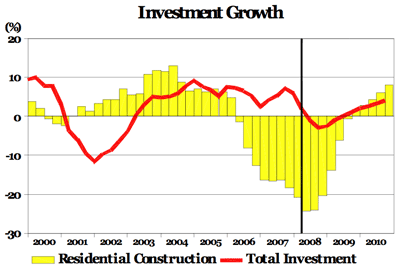
Business Fixed Investment (graph)
Business fixed investment is expected to moderate to a 0.8% growth rate in 2008, following the robust 4.7% growth rate in 2007. Growth moderates further to negative 0.3% in 2009 before rebounding to a 4.7% rate in 2010. Investment in producers’ durable equipment will grow an anemic 1.0% in 2008, slow to 0.8% in 2009, and rise again by 5.2% in 2010. Investment in structures is expected to rise by 0.4% in 2008, decline by 2.6% in 2009, and then grow by 3.7% in 2010. Residential investment will decline by 22.5% in 2008, decline again by 4.8% in 2009, and finally rise by 7.0% in 2010.
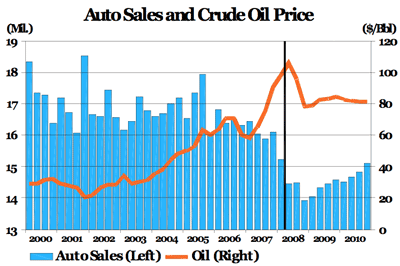
Oil and Vehicle Sales (graph)
In the early days of May, the price of oil averaged above $110 per barrel on fears of supply disruptions. Going forward, in the second quarter, expect the price of oil to average $105.7 per barrel and remain elevated throughout the rest of the year. Oil prices will average $94.3 per barrel in 2008, before moderating to approximately $82.0 per barrel mark in 2009 and 2010. Consequently, automobile and light truck sales will average only 14.5 and 14.4 million units in 2008 and 2009, respectively. A modest recovery is expected in 2010 with projected sales of 14.9 million units.
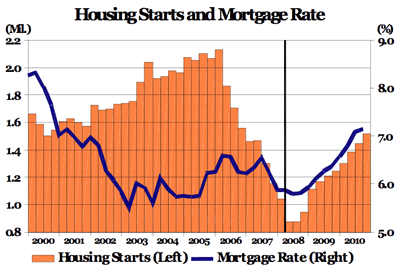
New Residential Construction (graph)
Housing starts, which have experienced a downward trajectory for almost three years, will finally bottom out by late 2008. After averaging 1.039 million units in the first quarter of 2008, housing starts will dip below the 1.000 million unit threshold in the coming quarters. Starts will average 0.930 million units in 2008 and will rise to 1.182 million units in 2009. Housing starts will rise again to 1.444 million units in 2010. The effective mortgage rate will average 5.8% in 2008, rise gradually to 6.1% in 2009, and then rise to 6.8% in 2010. It still will be below the levels seen in 2000.
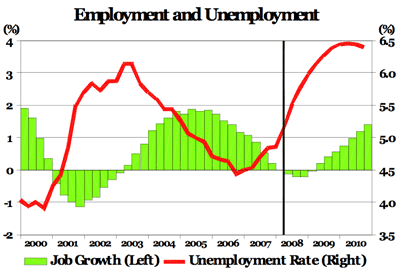
Job Growth (graph)
In the first four months of 2008, the economy shed jobs at a monthly rate 0f 65,000 jobs. The losses won’t stop there, unfortunately, as this rate will continue to deteriorate throughout the rest of the year, resulting in an average of 85,000 job losses per month for the year. The situation will improve in 2009, when the economy will add jobs at a rate of 70,000 jobs per month before improving to a monthly rate of 135,000 jobs in 2010. The unemployment rate will rise from 4.6% in 2007 to 5.3% in 2008. It will rise again to 6.0% in 2009 and then drop to 5.5% in 2010.
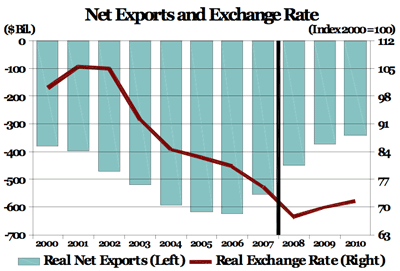
International Trade (graph)
The real trade-weighted dollar index will decline 10.0% in 2008 before finally appreciating by 3.6% in 2009 and by 2.0% in 2010. In 2007, exports grew robustly by 8.1% compared to only a 1.9% increase in imports. In 2008, exports will grow at a 7.5% rate whereas import growth will decline 0.1%. In 2009, export growth will moderate to 6.6% while import growth will lag at a slightly improved rate of 1.7%. In 2010, exports will again grow by 6.9% rate to trump the 4.6% import growth. The trade deficit will moderate gradually from $708.0 billion in 2007 to $572.6 billion in 2010.
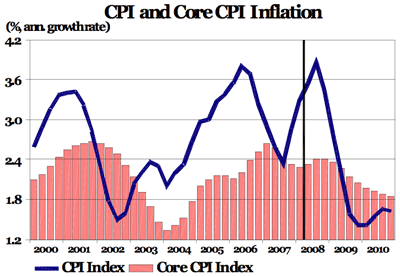
Inflation (graph)
In the first quarter of 2008, inflation was running at a 4.3% rate due to high energy prices, but it will moderate to 3.2% in the second quarter as the slowdown in demand pushes the headline inflation number down. For 2008, the inflation rate will average 3.7% and will moderate to a 1.7% rate in 2009. In 2010, the inflation rate will average 1.9%. Meanwhile, the core CPI inflation rate will average 2.4% in 2008, followed by 2.1% in both 2009 and in 2010. Wage compensation in the business sector will increase by a robust 3.9% in 2008. It will grow again by 3.6% in 2009 and by 3.5% in 2010.
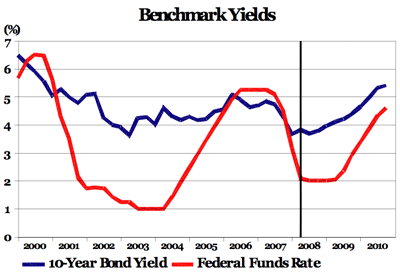
Interest Rates (graph)
As the global financial crisis intensified, the Fed has responded by cutting the Federal Funds Rate by a total of 325 basis points since September 2007. Going forward, expect the target rate to remain at 2.0%, as the Fed goes into a neutral monetary stance. The Fed will start raising rates by mid-2009. Meanwhile, the benchmark 10-year bond rate averaged 3.7% in the first quarter of 2008 and will fluctuate around this level in the next few quarters. On an annual basis, the 10-year bond rate will average 3.7% in 2008, rise to 4.2% in 2009, and average 5.1% in 2010.
Rajeev Dhawan is the director of the Economic Forecasting Center at J. Mack Robinson College of Business at Georgia State University.
print version | Tables (.xls) | Indicators | Highlights | Tennessee’s Business | BERC