Economic Indicators
by Rajeev Dhawan*
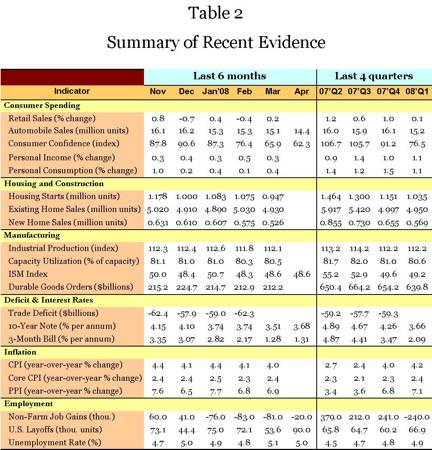
Employment Situation (graph)
The latest employment report turned out better than expected, with April payrolls falling only 20,000 — a much better result than March’s decline of 81,000. The improvements were concentrated primarily in professional and business services, where payrolls rose 39,000 after falling 44,000 in March. Robust job additions continued in Education and Health, with new job additions totaling 52,000 in April and almost 200,000 job since January. Corporate layoffs rose to just under 100,000 in April, an increase of 27.4% from levels a year ago. The unemployment rate stands at 5.0%.
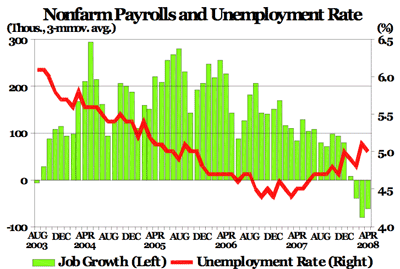
Consumer Price Index (graph)
The CPI rose 0.3% in March, fueled by higher energy prices. Food prices rose a moderate 0.2%, following two consecutive months of large gains — 0.7% in January and 0.4% in February. Over the past three months, the CPI index has advanced at a 3.1% annualized rate, a sharp moderation from the 6.2% pace seen in December. Meanwhile, the core CPI rose 0.2% in March, which makes for a 2.0% growth rate in the first three months of 2008. On a year-over-year basis, the core inflation rate ran at 2.4% in March, a slight acceleration from the 2.3% rate observed in February.
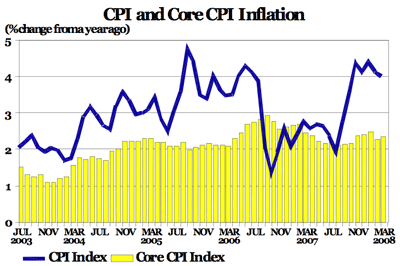
Producer Price Index (graph)
Producer prices for finished goods have exhibited wide swings in the past few months, rising and falling in response to volatile movements in prices for food and energy products. Recently, due to a renewed surge in energy prices, the producer price index rose by 1.1% in March, following a 0.3% increase in February. Year-over-year, the index is now up 6.9%, compared with a 6.4% rise in February. Excluding food and energy, the core PPI grew 0.2% in March, following a 0.4% increase in February. On a year-ago basis, core prices are now up 2.8%, compared with a 2.1% rise in December.
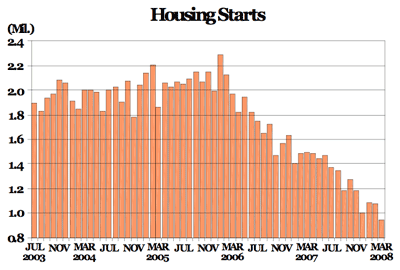
Housing Starts (graph)
Housing starts dropped 11.9% in March to a mere 0.947 million units, the lowest level since March 1991! Single-family starts fell 5.7%, while multifamily starts fell 24.6%. Total starts are now 36.5% below the levels seen a year ago, and in the past six months, housing starts averaged only 1.092 million units. During the past year across the nation, new residential construction has fallen by 46.5% in the Midwest, 38.0% in the West, 34.8% in the South, and 24.8% in the Northeast. Finally, single and multifamily permits are down 46.4% and 26.7%, respectively, since last March.
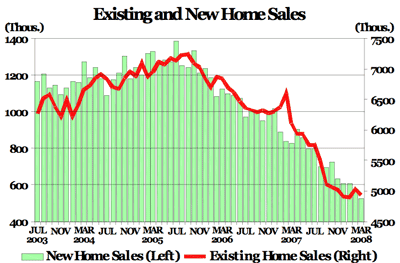
Existing and New Home Sales (graph)
The housing market continues to weaken despite falling interest rates. Existing home sales dropped 2.0% in March to 4.930 million units nationwide. On a year-ago basis, existing home sales dropped by nearly 19.3% with declines in all regions, ranging from 16% in the Midwest to 22% in the West. Meanwhile, new home sales also dropped 8.5% to an annual rate of 0.526 million units in March — the lowest level since October 1991. In the first quarter of 2008, new home sales averaged only 0.569 million units, down 13.1% from the previous quarter.
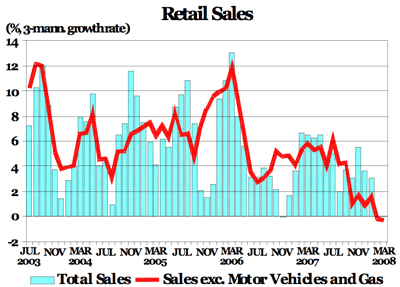
Retail Sales (graph)
Total retail sales rose 0.2% in March — not enough to reverse a 0.4% drop in February. This increase came entirely from rising gasoline prices, as sales, excluding auto dealers and gasoline, remained unchanged from the previous month, and were down 0.3% in the past three months. Following a 3.6% increase in the last quarter of 2007, total sales were flat in the first quarter of 2008. The ongoing housing malaise was reflected in sales at home furnishing stores and building material dealers, where sales fell 7.1% and 6.9%, respectively, from levels seen a year ago.
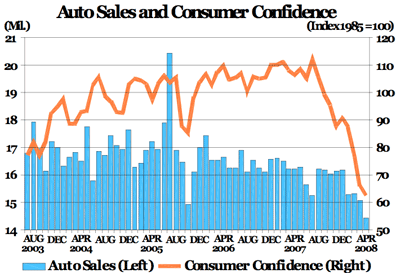
Auto Sales and Consumer Confidence (graph)
Consumer malaise spread into the auto market, as total vehicle sales plunged from 15.1 million units in March to 14.4 million units in April. With gasoline prices escalating, consumers have shunned light trucks, sales of which have fallen almost 17% since December. Meanwhile, the Big Three’s share of sales hit a new record low of 48.3%. The consumer confidence index fell for the fourth consecutive time in April, slipping from 65.9 in March to 62.3 last month, as deteriorating conditions in the housing and labor markets and high energy prices kept consumers’ anxiety levels elevated.
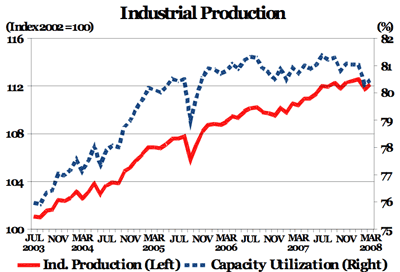
Industrial Production (graph)
The Industrial Production Index rose 0.3% in March, following a 0.7% decline in February. Mining production increased 0.9%, and manufacturing output added 0.1%, while utilities output rose 1.9%, following a 3.6% decline a month before. On a year-over-year basis, the overall index growth has decelerated substantially from 4%-plus levels seen in 2006 to only 1.5% in March 2008. The index also fell 0.1% in the first quarter of 2008, after rising at an annualized rate of 0.4% in the last quarter of 2007. The capacity utilization rate remained relatively steady over the past six months.
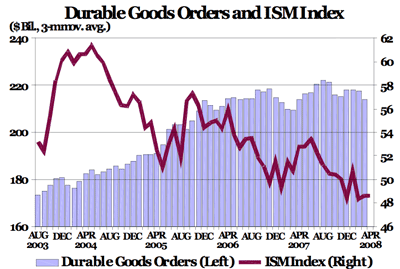
The ISM and Durable Goods Orders (graph)
The ISM (Institute for Supply Management) index was unchanged from March at 48.6 points. However, this status quo is of little consolation because the index still remains below its expansionary threshold of 50 points for the third consecutive month. Despite a strong rise in aircraft orders, durable goods orders fell from $212.9 billion in February to $212.2 in March, marking the third consecutive monthly decline in new orders, which fell at an 8.5% annualized rate in the first quarter. Meanwhile, new orders for non-defense goods were unchanged from February but have fallen 3.3% from last year.
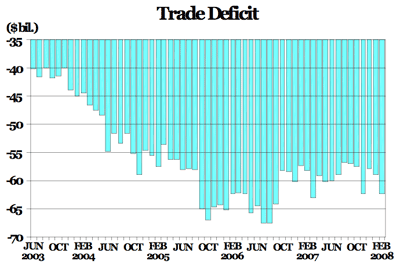
International Trade (graph)
The trade deficit widened by $3.3 billion, from a $59.0 billion deficit in January to $62.3 billion in February. Thanks to a weak dollar, total exports grew by a strong 2.0%, but imports grew stronger by 3.1% in February, fueled by non-oil imports. On a year-over-year basis, export growth is now running at a very strong rate of 20.8%, while import growth also has accelerated from 3.4% last August to 16.4% in February of this year. In the first two months of 2008, the trade deficit is running at an annual rate of $727.7 billion, 4.9% above the last year’s level of $693.5 billion.
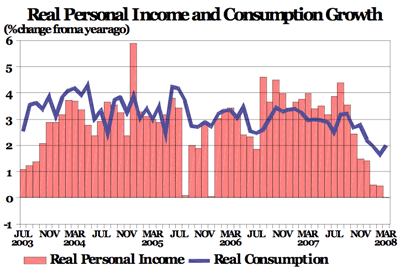
Personal Income and Consumption (graph)
Supported by a 0.5% increase in wages and salaries, personal income rose 0.3% in March, while consumer spending rose 0.4%, up from a tepid 0.1% gain in February. However, adjusted for inflation, both income and consumption were essentially flat. Moreover, real spending has increased only 1.0% in the first quarter of 2008, marking the worst quarterly reading since the 2001 recession. Finally, the core PCE index rose at an annual rate of 2.1%, just outside the boundaries of the Fed’s comfort zone, prompting fears that inflation might get out of hand.
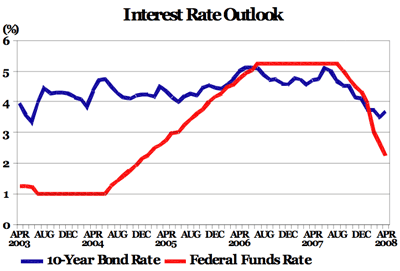
The Fed Funds and 10-Year Bond Rates (graph)
The FOMC (Federal Open Market Committee) voted at its meeting on April 30 to cut the federal funds rates by 25 basis points to 2.0%. The FOMC statement acknowledged the weakness in the economy and the fact that financial markets remain under considerable stress. But more important, the Fed has removed all references to downside risks to growth, signaling a possible pause in rate cuts. Meanwhile, the expectations of slower economic growth ahead pulled the yield on a 10-year T-bond down from 3.9% in February to 3.3% by mid-March. The rate on a 10-year Treasury bond rose again to 3.7% by early May.
Rajeev Dhawan is the director of the Economic Forecasting Center at J. Mack Robinson College of Business at Georgia State University.
print version | Tables (.xls) | Indicators | Highlights | Tennessee’s Business | BERC