Tracking Recovery continued
print pdf | 1 | 2 | 3 | 4 | 5 | 6 | 7 | 8 |
UnemploymentFigure 1 makes clear that the gap in Tennessee between the number in the labor force and the number employed widened after 2008. That means the number of people unemployed has increased. Statistics don't always tell the complete story. It is important to point out that the unemployed are only those people who report themselves as not working but are actively seeking work. Consequently, it does not include people who would accept a job if offered one. In other words, people who for whatever reason are not working and may be discouraged about finding work but would actually like to work are not included in these statistics. By the same token, the number of people employed includes people who may be working at jobs that underutilize their skills and experience, the so-called underemployed. The U.S. Bureau of Labor Statistics, the official keepers of labor market statistics, estimates these numbers and makes them available but not at the county level. When discouraged workers and the underemployed are added to the number unemployed, an alternative national unemployment rate is estimated to be 14.9% (BLS). Figure 4 below is a graph of the number of unemployed persons in Coffee County. The graph shows that the number of unemployed peaked in the summer of 2009, remained at about 2,600 people for several months, and recently dipped to about 2,250 people.
|
|
|
Fig. 4. Coffee County Unemployed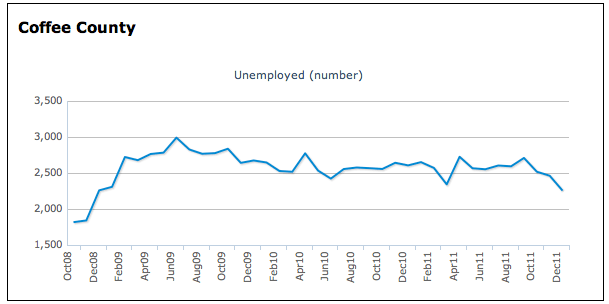
|
||