Tracking Recovery continued
print pdf | 1 | 2 | 3 | 4 | 5 | 6 | 7 | 8 |
Unemployment RateThe unemployment rate is the percent of unemployed persons in the labor force. If the number of unemployed persons increases while the labor force remains constant, the unemployment rate will increase. Figure 5 below shows the unemployment rate for Dyer County. The disappointing pattern shows the unemployment rate peaking in the summer of 2009 and then falling, only to begin rising again in the summer of 2010. In late 2011 the rate began to fall again. Very simply, it reflects the structure of the economy of the county. This situation emphasizes the point that economic conditions are not identical across the state, the nation, or the world. Local data and information are essential to understanding the current situation and planning for the future.
|
|
|||||||||||||||||||||||||||||||||||||||||||||||||||||||||||||||||||||||||||||||
Fig. 5. Dyer County Unemployment Rate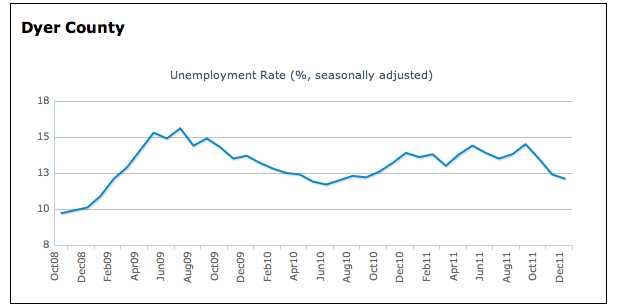 |
||||||||||||||||||||||||||||||||||||||||||||||||||||||||||||||||||||||||||||||||
| As stated earlier, statistics by county and for the 10 MSAs across the state are available on the Tracking Tennessee's Economic Recovery site. Table 2 below gives the history of the unemployment rate in those areas since the beginning of the recession in December 2007. Once again, the painful experience of this period is evident with the unemployment rates rising, then falling, and recently, at least within Tennessee, rising again.
|
The unemployed are only those people who report themselves as not working but are actively seeking work. |
|||||||||||||||||||||||||||||||||||||||||||||||||||||||||||||||||||||||||||||||
Table 2. Unemployment rate (% of labor force) for TN MSAs (not seasonally adjusted)
Source: BERC, BLS
|
||||||||||||||||||||||||||||||||||||||||||||||||||||||||||||||||||||||||||||||||