Tennessee 2010 Census Report
| by Randy Gustafson | print pdf | Flash flip-book | «previous | next» |

[ larger view ]
Tennesseans 65 and Over, 2000-2010 |
||
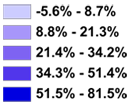
By far, the segment of the population with the highest growth rate is the 65-and-over cohort. In 2000, there were 281,882 males and 421,429 females for a total of 703,311 Tennesseans 65 years of age or older. In 2010, that total had grown to 853,462: 366,035 males and 487,427 females. The growth rates were thus 29.9% for males and 15.7% for females. The map above shows the county-level growth rates for people aged 65 and over. There are eight counties where the percentage of all males who were 65 or older exceeds 17.5%. However, over half of the counties in the state had a greater than 17.5% share of women who are 65-plus. While the statewide percentage of non-White people 65 and over is 12.2%, there are very large swaths of the state where the percentage is less than 5%. Finally, we look at the make-up of Tennessee households: By far, the segment of the population with the highest growth rate is the 65-and-over cohort. |
||
| Randy Gustafson is the director of the Tennessee State Data Center. | ||

