Tennessee 2010 Census Report
| by Randy Gustafson | print pdf | Flash flip-book | «previous | next» |
[ larger view ] [ Click on each county for details. ]
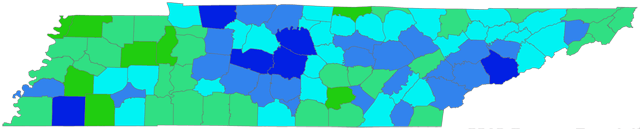
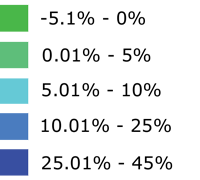
County Population Growth, 2000-2010 |
||
| County-level growth rates varied widely with the two fastest-growing counties, Williamson and Rutherford, growing 44.7% and 44.3%, respectively. Several counties, Haywood, Grundy, Carroll, Hardeman, Obion, Lake, Clay, and Benton, lost population over the decade. The map shows the growth of population in the 95 counties in Tennessee. It is readily apparent that the middle Tennessee area surrounding the capital city of Nashville experienced the greatest growth. In fact, 11 counties in middle Tennessee accounted for more than half the growth of the entire state: Rutherford, Davidson, Williamson Montgomery, Sumner, Wilson, Robertson, Maury, Bedford, Dickson, and Coffee. Another pocket of growth appears to be centered in Knoxville with Knox, Sevier, Blount, and Loudon Counties growing by over 95,000. The table shows the county-level population and percent change of all 95 counties. |
|
Tennessee Population Growth by County, 2000-2010 [ .xlsx ]
|
2000 Population |
2010 Population |
|
% |
|
|
| Anderson | 71,330 | 75,129 | 3,799 | 5.33% | ||
| Bedford | 37,586 | 45,058 | 7,472 | 19.88% | ||
| Benton | 16,537 | 16,489 | (48) | -0.29% | ||
| Bledsoe | 12,367 | 12,876 | 509 | 4.12% | ||
| Blount | 105,823 | 123,010 | 17,187 | 16.24% | ||
| Bradley | 87,965 | 98,963 | 10,998 | 12.50% | ||
| Campbell | 39,854 | 40,716 | 862 | 2.16% | ||
| Cannon | 12,826 | 13,801 | 975 | 7.60% | ||
| Carroll | 29,475 | 28,522 | (953) | -3.23% | ||
| Carter | 56,742 | 57,424 | 682 | 1.20% | ||
| Cheatham | 35,912 | 39,105 | 3,193 | 8.89% | ||
| Chester | 15,540 | 17,131 | 1,591 | 10.24% | ||
| Claiborne | 29,862 | 32,213 | 2,351 | 7.87% | ||
| Clay | 7,976 | 7,861 | (115) | -1.44% | ||
| Cocke | 33,565 | 35,662 | 2,097 | 6.25% | ||
| Coffee | 48,014 | 52,796 | 4,782 | 9.96% | ||
| Crockett | 14,532 | 14,586 | 54 | 0.37% | ||
| Cumberland | 46,802 | 56,053 | 9,251 | 19.77% | ||
| Davidson | 569,891 | 626,681 | 56,790 | 9.97% | ||
| Decatur | 11,731 | 11,757 | 26 | 0.22% | ||
| DeKalb | 17,423 | 18,723 | 1,300 | 7.46% | ||
| Dickson | 43,156 | 49,666 | 6,510 | 15.08% | ||
| Dyer | 37,279 | 38,335 | 1,056 | 2.83% | ||
| Fayette | 28,806 | 38,413 | 9,607 | 33.35% | ||
| Fentress | 16,625 | 17,959 | 1,334 | 8.02% | ||
| Franklin | 39,270 | 41,052 | 1,782 | 4.54% | ||
| Gibson | 48,152 | 49,683 | 1,531 | 3.18% | ||
| Giles | 29,447 | 29,485 | 38 | 0.13% | ||
| Grainger | 20,659 | 22,657 | 1,998 | 9.67% | ||
| Greene | 62,909 | 68,831 | 5,922 | 9.41% | ||
| Grundy | 14,332 | 13,703 | (629) | -4.39% | ||
| Hamblen | 58,128 | 62,544 | 4,416 | 7.60% | ||
| Hamilton | 307,896 | 336,463 | 28,567 | 9.28% | ||
| Hancock | 6,786 | 6,819 | 33 | 0.49% | ||
| Hardeman | 28,105 | 27,253 | (852) | -3.03% | ||
| Hardin | 25,578 | 26,026 | 448 | 1.75% | ||
| Hawkins | 53,563 | 56,833 | 3,270 | 6.10% | ||
| Haywood | 19,797 | 18,787 | (1,010) | -5.10% | ||
| Henderson | 25,522 | 27,769 | 2,247 | 8.80% | ||
| Henry | 31,115 | 32,330 | 1,215 | 3.90% | ||
| Hickman | 22,295 | 24,690 | 2,395 | 10.74% | ||
| Houston | 8,088 | 8,426 | 338 | 4.18% | ||
| Humphreys | 17,929 | 18,538 | 609 | 3.40% | ||
| Jackson | 10,984 | 11,638 | 654 | 5.95% | ||
| Jefferson | 44,294 | 51,407 | 7,113 | 16.06% | ||
| Johnson | 17,499 | 18,244 | 745 | 4.26% | ||
| Knox | 382,032 | 432,226 | 50,194 | 13.14% | ||
| Lake | 7,954 | 7,832 | (122) | -1.53% | ||
| Lauderdale | 27,101 | 27,815 | 714 | 2.63% | ||
| Lawrence | 39,926 | 41,869 | 1,943 | 4.87% | ||
| Lewis | 11,367 | 12,161 | 794 | 6.99% | ||
| Lincoln | 31,340 | 33,361 | 2,021 | 6.45% | ||
| Loudon | 39,086 | 48,556 | 9,470 | 24.23% | ||
| McMinn | 49,015 | 52,266 | 3,251 | 6.63% | ||
| McNairy | 24,653 | 26,075 | 1,422 | 5.77% | ||
| Macon | 20,386 | 22,248 | 1,862 | 9.13% | ||
| Madison | 91,837 | 98,294 | 6,457 | 7.03% | ||
| Marion | 27,776 | 28,237 | 461 | 1.66% | ||
| Marshall | 26,767 | 30,617 | 3,850 | 14.38% | ||
| Maury | 69,498 | 80,956 | 11,458 | 16.49% | ||
| Meigs | 11,086 | 11,753 | 667 | 6.02% | ||
| Monroe | 38,961 | 44,519 | 5,558 | 14.27% | ||
| Montgomery | 134,768 | 172,331 | 37,563 | 27.87% | ||
| Moore | 5,740 | 6,362 | 622 | 10.84% | ||
| Morgan | 19,757 | 21,987 | 2,230 | 11.29% | ||
| Obion | 32,450 | 31,807 | (643) | -1.98% | ||
| Overton | 20,118 | 22,083 | 1,965 | 9.77% | ||
| Perry | 7,631 | 7,915 | 284 | 3.72% | ||
| Pickett | 4,945 | 5,077 | 132 | 2.67% | ||
| Polk | 16,050 | 16,825 | 775 | 4.83% | ||
| Putnam | 62,315 | 72,321 | 10,006 | 16.06% | ||
| Rhea | 28,400 | 31,809 | 3,409 | 12.00% | ||
| Roane | 51,910 | 54,181 | 2,271 | 4.37% | ||
| Robertson | 54,433 | 66,283 | 11,850 | 21.77% | ||
| Rutherford | 182,023 | 262,604 | 80,581 | 44.27% | ||
| Scott | 21,127 | 22,228 | 1,101 | 5.21% | ||
| Sequatchie | 11,370 | 14,112 | 2,742 | 24.12% | ||
| Sevier | 71,170 | 89,889 | 18,719 | 26.30% | ||
| Shelby | 897,472 | 927,644 | 30,172 | 3.36% | ||
| Smith | 17,712 | 19,166 | 1,454 | 8.21% | ||
| Stewart | 12,370 | 13,324 | 954 | 7.71% | ||
| Sullivan | 153,048 | 156,823 | 3,775 | 2.47% | ||
| Sumner | 130,449 | 160,645 | 30,196 | 23.15% | ||
| Tipton | 51,271 | 61,081 | 9,810 | 19.13% | ||
| Trousdale | 7,259 | 7,870 | 611 | 8.42% | ||
| Unicoi | 17,667 | 18,313 | 646 | 3.66% | ||
| Union | 17,808 | 19,109 | 1,301 | 7.31% | ||
| Van Buren | 5,508 | 5,548 | 40 | 0.73% | ||
| Warren | 38,276 | 39,839 | 1,563 | 4.08% | ||
| Washington | 107,198 | 122,979 | 15,781 | 14.72% | ||
| Wayne | 16,842 | 17,021 | 179 | 1.06% | ||
| Weakley | 34,895 | 35,021 | 126 | 0.36% | ||
| White | 23,102 | 25,841 | 2,739 | 11.86% | ||
| Williamson | 126,638 | 183,182 | 56,544 | 44.65% | ||
| Wilson | 88,809 | 113,993 | 25,184 | 28.36% |
Source: U.S. Census Bureau
Randy Gustafson is the director of the Tennessee State Data Center.